6 Effective Methods for Trend Analysis in Stock Markets
Jan 01, 2000 By Sana
Advertisement
Navigating the ups and downs of the stock market can feel like a rollercoaster, provoking frustration when portfolio gains reverse into sudden losses.
Rather than anxiously awaiting the next twist and turn, what if you could spot profitable trends amidst the chaos?
Learning to analyze stock charts provides the key. Price action forms patterns - dismissing the noise and revealing insights into emerging opportunities.

This post uncovers six straightforward methods to identify trends, forecast changes, and boost performance. Applying these tools transforms investing from a game of chance into a strategic endeavour.
Master these analytical techniques to gain an edge and prosper through various market cycles.
6 Handy Tools to Spot & Profit from Stock Trends
Now, we'll share the six effective methods savvy traders use to analyze stock market trends. Understanding these techniques can help you identify patterns and profit from emerging opportunities.
1. Trendlines - Connect the Dots
Trendlines are drawn by connecting the peaks and troughs in price charts over time. Multiple touches along a trendline strengthen its validity.
Upward-sloping trend lines indicate bullish sentiment, while downward-sloping lines suggest bearishness. Breaks above or below established trendlines often signal a trend reversal - providing an opportunity to enter or exit trades.
You can draw a horizontal line connecting the previous price response to detect a rebound. The intersecting horizontal and sloped trendlines show where declines may find support.
2. Moving Averages (MAs) - Smoothing Out The Bumps
Moving averages calculate the average closing price over set intervals, often 50, 100 or 200 days. Comparing moving averages of different durations gauges market views - short vs long-term.
Crossovers occur when a shorter moving average crosses above or below a longer moving average, signalling bullish or bearish momentum shifts. Since moving averages lag prices, they avoid false signals vs more twitchy indicators.
A stock breaking out above a long-term moving average confirms buyers have overwhelmed seller resistance over an extended timeframe.
3. Volume - Following the Crowd Trails
Tracking volume paints a picture of accumulating or fading enthusiasm. Spikes in volume signify heightened commitment behind a price swing in either direction.
Watch for heavy-volume breakouts - indicating growing participation toward the new trend. Light volume on extended price moves warns of waning conviction.
Volume trailing off as prices rise suggests the rally may soon exhaust itself. This bearish divergence signals impending weakness. Volume analysis tracks money flow - revealing when investor sentiment appears misaligned with price action.
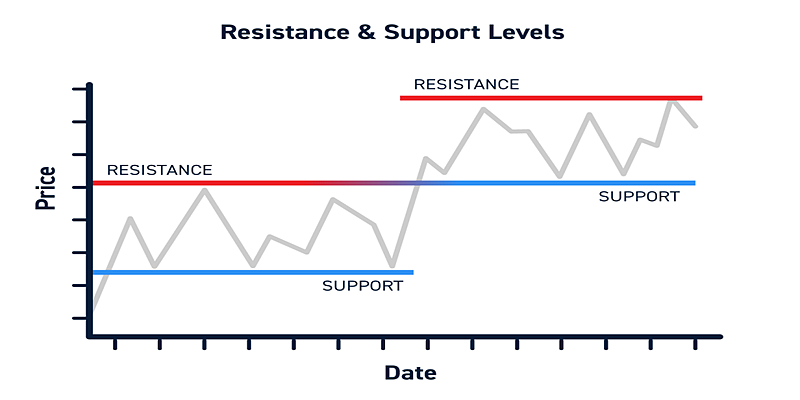
4. Support & Resistance Levels - Where Trends Pause, Reverse
Support levels mark where falling prices repeatedly stall and rebound. Resistance shows where rising prices consistently peak and retreat. Strong supply (on resistance) or demand (at support) typically exists at these price levels.
Plotting support and resistance visualizes the trading range and highlights critical inflexion points. Breaks above resistance signal upside potential, while drops below support confirm weakness.
Sketching these levels creates a map for planning profitable entries and exits - such as buying at tested support with sell targets near highlighted resistance zones.
5. Market Indicators - Tracking The Herd
Market indicators assess participation and appetite for risk on a broad level. Comparing indicators against major indexes diagnoses divergences.
For example, markets steadily rise while the Volatility Index plummets, warning of investor complacency. Any reversal could trigger volatile fallout.
Weak participation signals shown by deteriorating market breadth (more stocks declining than advancing) also frequently precede market tops as rallies narrow.
Applying indicators reveals when crowd positioning appears mismatched with current price trends - indicating an impending trend reversal may be ahead.
6. Channel Analysis - Boundaries in The Sand
Channel analysis utilizes parallel trend lines containing price action. Channels clarify the steepness, volatility, and longevity of a trend. The upper and lower channel boundaries can highlight levels to anticipate potential turning points.
A break above an ascending channel signals bullish acceleration, while a downside fallout confirms a loss of momentum. Price repeatedly testing channel support or resistance helps gauge ongoing demand and supply levels.
Trading channels display normalcy for extended trends, while breakouts and breakdowns typically mark meaningful shifts in investor sentiment and prices.
Conclusion
These six methods for analyzing trends provide insights into current and potential future market moves.
Using trendlines, moving averages, volume, support/resistance, market indicators, and channel analysis can improve your stock market timing and success rate.
We encourage you to experiment with these techniques. Finding which trend analysis tools work best with your trading system is critical to maximizing performance.
Feel free to refer back to this quick guide on effective methods for trend analysis whenever the need arises!
On this page
6 Handy Tools to Spot & Profit from Stock Trends 1. Trendlines - Connect the Dots 2. Moving Averages (MAs) - Smoothing Out The Bumps 3. Volume - Following the Crowd Trails 4. Support & Resistance Levels - Where Trends Pause, Reverse 5. Market Indicators - Tracking The Herd 6. Channel Analysis - Boundaries in The Sand Conclusion
Jan 01, 2000
Stock Market
4 Strategies for Using MACD Indicator Efficiently
This article will explore four practical strategies for utilizing the MACD indicator to its full potential. You're a beginner seeking to master the MACD or an experienced trader hoping to refresh your knowledge.

Jan 01, 2000
Stock Market
How to Invest in Blue-Chip Stocks Wisely
"Blue-chip funds" are equities of well-known companies with an established reputation in the shares market and a history of steady success. Here are some pointers to help novices who want to dabble in investing make an intelligent navigation of the blue-chip shares market.

Jan 01, 2000
Stock Market
7 Winning Strategies for Trading Stocks in a Sideways Market
Are you feeling stuck in the mud lately when trading stocks? You're not alone. Sideways markets, where stock prices meander in a range without clear trends, can frustrate traders.

Jan 01, 2000
Stock Market
How to Understand and Use Stock Market Indicators
The fluctuations in stock prices often resemble a rollercoaster ride. But fear not! Understanding and using stock market indicators can be your trusty guide through the twists and turns of investing.

Jan 01, 2000
Stock Market
6 Effective Methods for Trend Analysis in Stock Markets
This post uncovers six straightforward methods to identify trends, forecast changes, and boost performance. Applying these tools transforms investing from a game of chance into a strategic endeavour.

Jan 01, 2000
Stock Market
8 Advanced Techniques in Volume Analysis for Stock Trading
In this blog post, we'll explore eight advanced techniques you can utilize in volume analysis to make more informed trading decisions.

Jan 01, 2000
Stock Market
How to Avoid Emotional Investing
Mastering the art of avoiding emotional trading starts with recognizing the emotional responses that typically disrupt logical investment decisions. Key emotions such as anxiety, euphoria, or overconfidence can skew an investor's perspective, leading to choices that stray from their investment objectives or the market's reality.

Jan 01, 2000
Stock Market
Where to Get Real-Time Stock Alerts
In the dynamic realm of stock trading, staying informed with immediate updates is critical for investors. This guide delves into the top methods to access real-time stock alerts, ensuring you're always on top of market fluctuations.

Jan 01, 2000
Stock Market
Top 5 Mistakes New Stock Investors Make
This detailed guide aims to shed light on the top five blunders new stock market participants commonly make. By recognizing and steering clear of these frequent missteps, one can approach stock investment with greater confidence and insight.

Jan 01, 2000
Stock Market
7 Common Mistakes in Reading Stock Charts and How to Avoid Them?
This blog post will discuss seven common mistakes in reading Stock Charts and how to avoid them. Understanding these common errors can help you become a more brilliant chart reader.

Jan 01, 2000
Stock Market
What Factors Influence Stock Prices the Most
The stock market is a dynamic and multifaceted arena where various factors interplay to determine the movements in stock prices. This article comprehensively analyses the significant factors affecting stock prices, offering fresh insights into the elements that sway the stock market.

Jan 01, 2000
Stock Market
4 Key Technical Indicators for Effective Market Prediction
This blog post will discuss the four key technical indicators that can significantly improve your analysis and provide compelling market predictions.

Jan 01, 2000
Stock Market
Where to Look for Undervalued Stocks
The quest to find undervalued stocks is akin to uncovering hidden treasures in the vast world of investments. This guide is tailored to illuminate the paths for discovering valuable undervalued stock picks that might be overlooked.

Jan 01, 2000
Stock Market
Retirement Planning with Stocks
Embarking on the journey towards a financially secure retirement necessitates a multifaceted approach to investments, with a significant focus on the stock market. This detailed exploration emphasizes the pivotal role of retirement stock investing.